
|
By Scott Urban, Oxfordshire Liveable Streets Summary Oxfordshire Liveable Streets worked with several partners to support a Healthy Streets survey in Oxford. The location was Florence Park in the Eastern side of the city. The surveys took place in July 2019. They were designed and led by three MSc students of Oxford Brookes University under the guidance of Dr Tim Jones of the School of the Built Environment. Other partners included the Coalition for Healthy Streets and Active Transport (CoHSAT), Co-CAFE at Oxford Brookes University, and the Florence Park Traffic Group. The surveys were based on the Healthy Streets methodology used extensively by Transport for London. The surveys were conducted partly through letterbox-drops and partly online. Every household in the estate was covered. This is an area of approximately 1000 households. One dimension of the surveys sought to illuminate to what extent respondents' views were potentially consistent with application of the 'low traffic neighbourhood' (LTN) concept. This has been deployed in the Waltham Forest borough of London, for example. As depicted in the graphs below, sentiment in the surveys is consistent with concerns about the amount of vehicular traffic using the estate as a cut-through. There is also support for the view that more short-distance trips currently done by car could be done by walking or cycling. OLS propose a number of learnings from this survey that could be taken into a future iteration. Sample One copy of the survey was delivered to every address in the estate, which is 2.1 miles south of Oxford city centre. It is bounded by Iffley Road / Henley Avenue (A4158) to the west/southwest, Church Cowley Road (B4495) to the south, Oxford Road (B480) to the west, and Florence Park itself to the North. Respondents were requested to drop their completed survey at a local pub or a local cafe. Householders were also provided with the alternative of completing the survey on-line. There were 91 responses to the survey. It is difficult to know to what extent the survey responses represented a random sample of the estate's population. It may be the case that only households motivated by the survey name or the survey questions bothered to complete it. If so, then the sample is biased and cannot be held as reflective of the estate's population. 59% of the sample were women, 36% were men and 4% did not indicate a sex. The average age (median and mean) was 51 and ages were normally distributed. 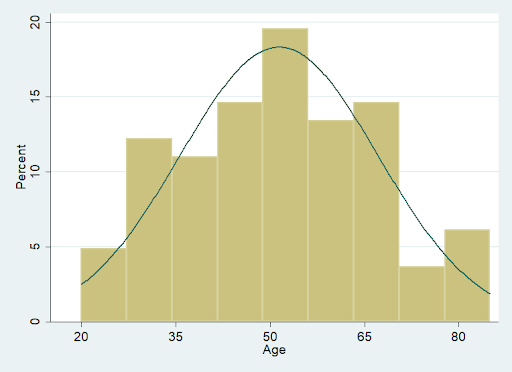 Figure 1: Distribution of respondent ages. The normal distribution is indicated by line. 12% of respondents stated their day-to-day activities were limited due to a health condition or disability. 62% of the sample had one car at the household, 23% had two cars and 1% had three or more. 13% had no car at the household. In terms of transport choices, walking was the most frequent with 72% of respondents indicating that more than 10% of their weekly journeys were taken on foot. Private car (as a driver or passenger, e.g. in a taxi) was the second most frequent with 57% of respondents indicating this was the method of more than 10% of their journeys. 53% of respondents indicated using a cycle for more than 10% of journeys. 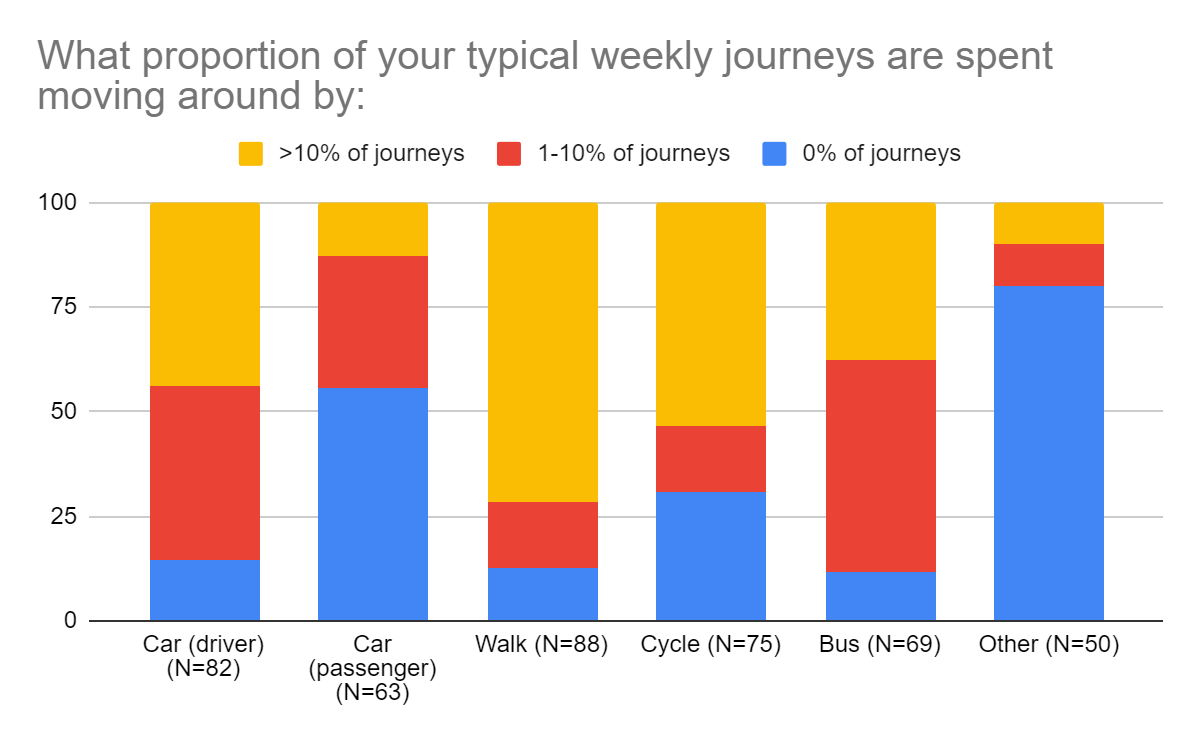 Figure 2: Mode choice (% of respondents on y axis) Low-traffic neighbourhood? A number of the questions provided insight into the degree to which the area might be suitable for development as a low-traffic neighbourhood (LTN). A large proportion of respondents disagreed that the amount and speed of traffic was appropriate for the area's streets. An even larger majority disagreed that sufficient steps had been taken to reduce the attractiveness of residential streets as short-cuts for motor vehicles. An even larger proportion indicated that they felt more could be done to restrict traffic and that local trips, currently being made by car, could be made by cycle or walking. 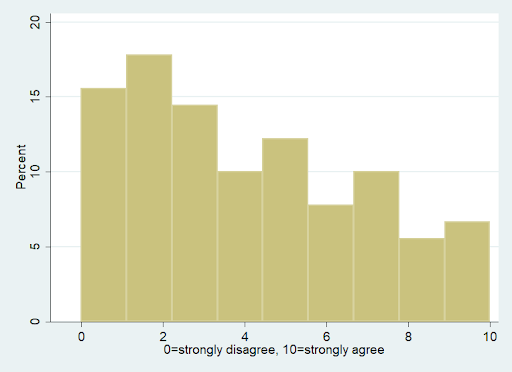 Q11: "The amount and speed of traffic and driver behaviour is appropriate for the type of streets in the area" (N=90) 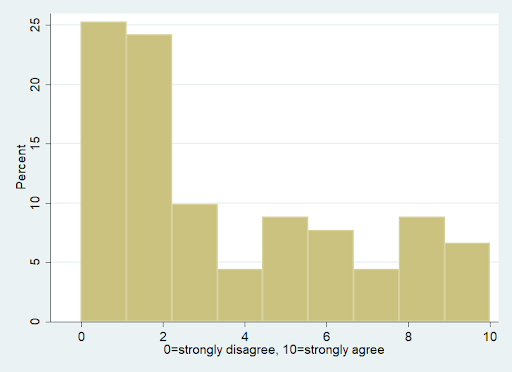 Q15: "Sufficient steps have been taken to reduce the attractiveness of residential streets as short-cuts for motor vehicles" (N=91) 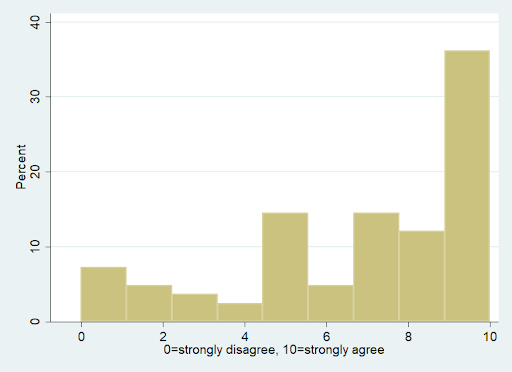 Q54: "It is possible to reduce the amount of traffic using the street or restrict access to low polluting vehicles" (N=83) 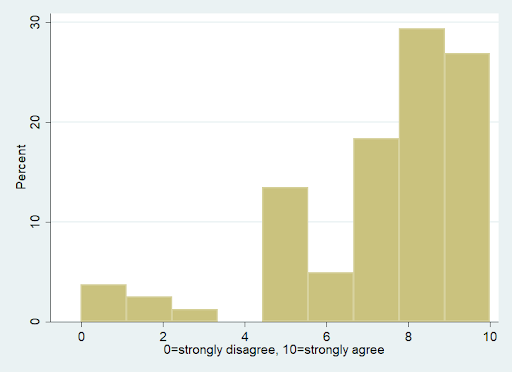 Q52: "People drive short trips, when they could walk or cycle." (N=82) Next steps The surveys uncovered some very interesting information, both about the modes that people currently use and the way that people feel about their streets. As the response rate was quite low (less than 100 out of a potential population of 2,685 people aged 15+ in mid-2015), it would be useful to repeat the survey and try to achieve a larger and more representative sample. There are several ways that a larger sample might be achieved and that are worth considering. These include: * Fewer questions There were 59 questions in the survey. These were necessary to cover the spectrum of Healthy Streets indicators (Figure 3). It should be established in a pilot or test setting whether this is too many questions for many people to engage with. It may be preferable, for example, to focus on only a subset of the Healthy Streets indicators. * Door-to-door survey Response rates might improve if sufficient people can be recruited to distribute and collect the survey or to administer the survey on the doorstep directly with householders. This would have to follow careful scripting in order to avoid biasing the results. * Street/event surveying People could be interviewed on the street, in local cafes, outside of shopping areas, in parks, and other locations in and around Florence Park. There are also several 'key dates' on the calendar of the community where a stall or table could be set out with a few volunteers, to help explain the survey and encourage people to respond to it. These include Flo Fest, Elder Stubbs Festival, FPCA Street Party, City Farm Open Day, and others. We welcome ideas for conducting the next survey and volunteers to help administer it. Scott Urban Oxfordshire Liveable Streets 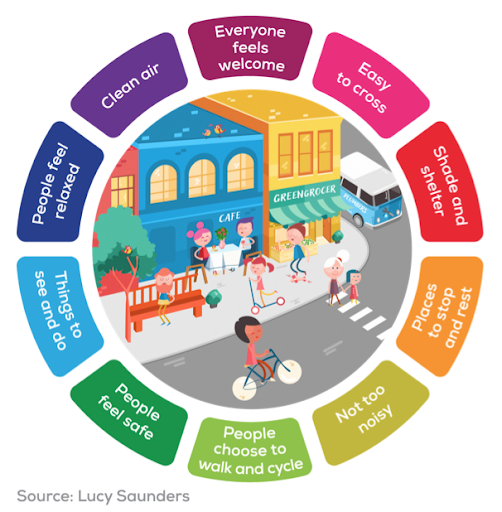 Figure 3: Healthy Streets Indicators
3 Comments
Sara Reevell
2/15/2020 03:44:55 am
We love the idea of a lie traffic neighbourhood in Florence Park, please get in touch if you'd like a space at Flofest to reach out to people. 2/15/2020 11:50:00 pm
Although the response ratio is low, the report highlights the important need to reduce 'short distance journeys', initiatives such walking buses during term time might reduce or help introduce a culture of change. Leave a Reply. |
AuthorsCo-CAFE is led by Tim Jones (Reader in Urban Mobility) with Ben Spencer (Research Fellow) and Tom Shopland (Co-CAFE project administrator) based in the School of the Built Environment at Oxford Brookes University. Archives
February 2020
Categories |
 RSS Feed

|

|

|
Oxford Brookes University
School of the Built Environment +44 1865 48 4061 |
|
Funded by the Lifelong Health and Wellbeing cross-Council programme. Grant No. EP/KO37242/1
|